


ASME PTC 19.3TW sets two thermowell frequency danger zones, not one. Here’s the resonance physics, the 1995 reactor case, and when limits don’t apply.
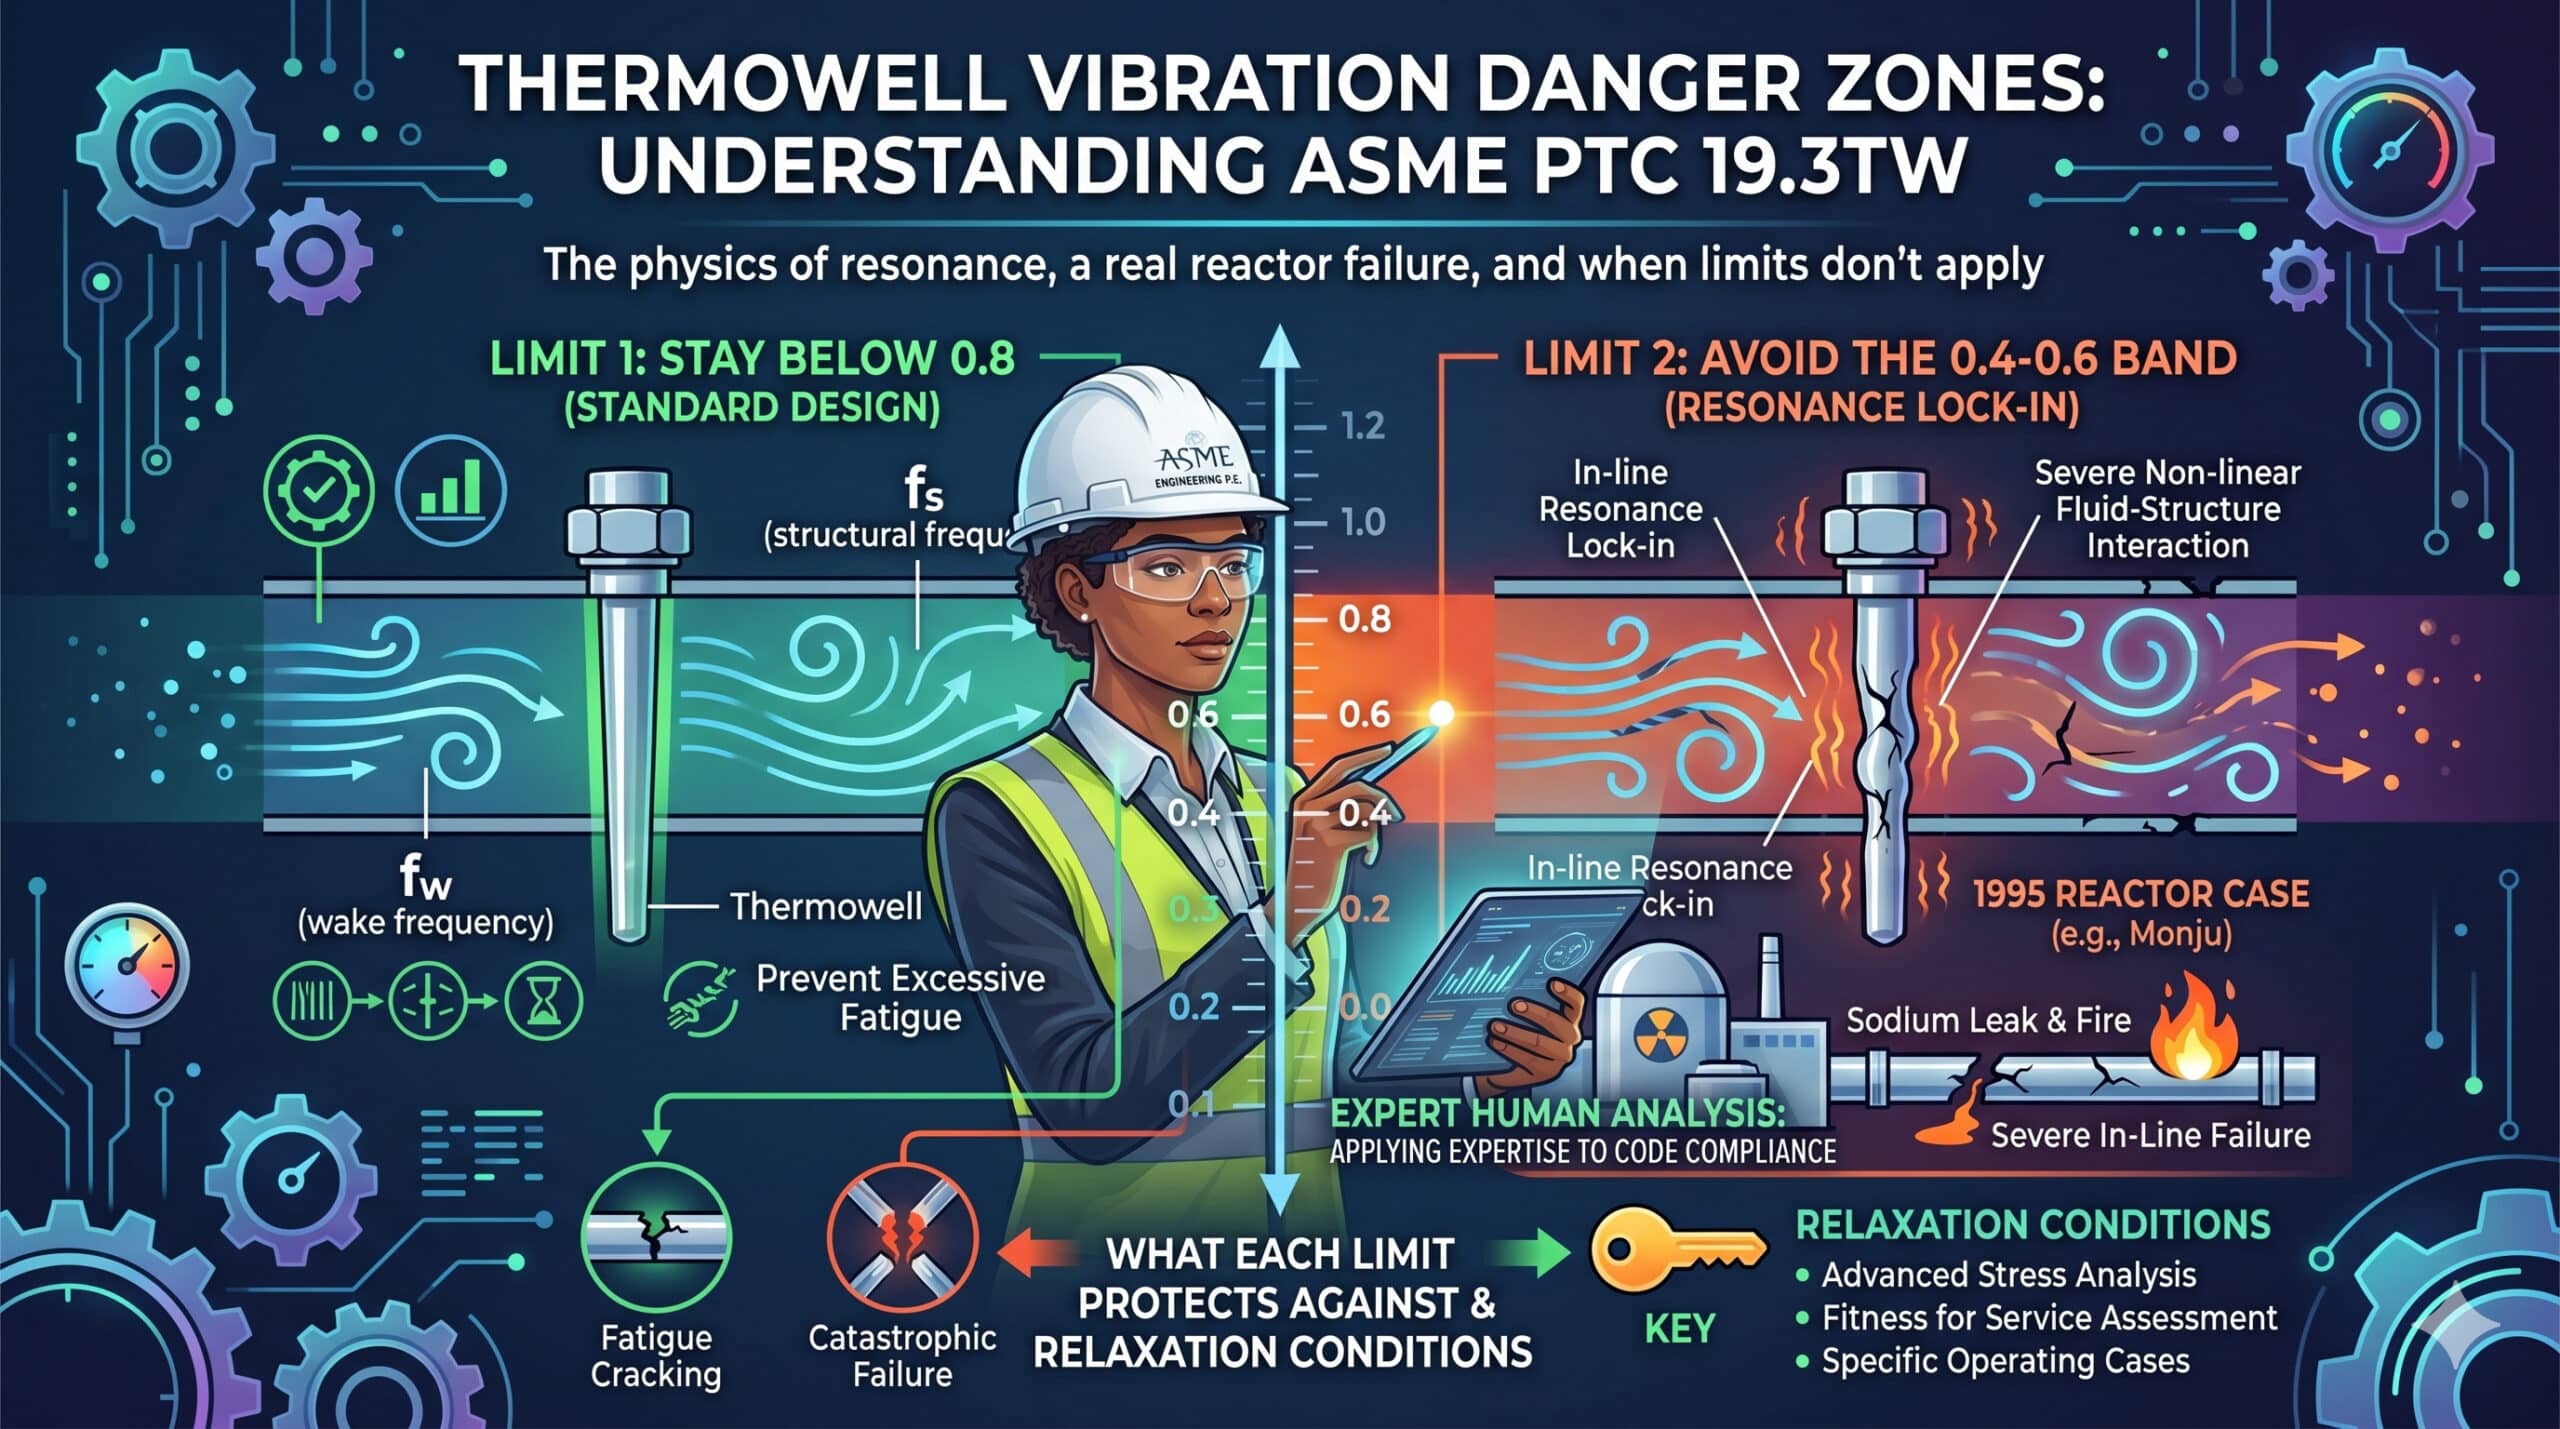
Run a wake frequency calculation (WFC) on a thermowell and ASME PTC 19.3TW hands you one instruction: keep the frequency ratio below 0.8, and stay out of the 0.4 to 0.6 band entirely.
Most engineers treat these as arbitrary safety numbers and move on. They aren’t arbitrary. Each limit traces back to a specific physical failure mechanism, and one of them is tied to a reactor shutdown that lasted 15 years.
Here’s why both limits exist, what they’re actually protecting against, and the conditions under which you’re allowed to relax them.
What resonance actually does to a thermowell
A thermowell sitting in flowing fluid, perpendicular to the flow direction, sheds vortices alternately off its two sides. Each shed vortex creates a small sideways push on the thermowell — engineers call this the lift force, also known as the transverse or dynamic force.
This push isn’t constant. It alternates back and forth at a frequency that depends on the fluid velocity and the thermowell’s diameter. That’s the vortex shedding frequency.
The thermowell itself, like any cantilevered structure, has its own natural frequency — the rate at which it would vibrate if you plucked it and let it go.
Divide one by the other and you get the frequency ratio:
Frequency ratio = vortex shedding frequency ÷ natural frequency of the thermowell
Think of pushing a swing. Push it randomly and not much happens. Push it in rhythm with its own natural back-and-forth, and the amplitude builds with every push — even though each individual push is small. That’s resonance.
When the shedding frequency lines up with the thermowell’s natural frequency, the same thing happens: every vortex adds energy in sync with the structure’s own motion, and the vibration amplitude — and the cyclic stress at the thermowell root — climbs sharply.
That’s the condition ASME PTC 19.3TW is built to keep you away from.
1. Danger Zone 1 — why the limit is 0.8, not 1.0
If resonance happens exactly at a frequency ratio of 1.0, you might expect the standard to simply say “keep the ratio away from 1.0.” Instead it draws a hard limit at 0.8. The 20% gap between 0.8 and 1.0 exists for two reasons.
1. Lock-in. Once the vortex shedding frequency gets close enough to the thermowell’s natural frequency, the shedding process can actually start synchronizing with the structure’s own motion rather than the other way around — the vibrating thermowell begins to influence the flow that’s exciting it.
Inside this lock-in band, the structure doesn’t just touch resonance briefly and move past it; it tends to stay locked near peak amplitude across a range of velocities. Pulling out of lock-in takes a more significant change in flow velocity than getting into it did.
2. Margin for everything the calculation can’t see. Thermowell wall thickness has manufacturing tolerance. Material property data in most references is given to three significant figures.
The WFC equations themselves carry simplifying assumptions about boundary conditions and mode shapes. None of these show up as a separate term in the calculation — they show up as the 20% band the standard builds in around the resonance point.
2. Danger Zone 2 — the band most engineers forget
Lift force isn’t the only force acting on the thermowell. There’s a second one: drag force, also called the in-line or static force, acting along the direction of flow rather than across it.
Drag force isn’t created by alternating vortices on opposite sides — it’s created by the same vortex shedding cycle pulsing the in-line force at exactly twice the frequency of the lift force.
So if your thermowell’s natural frequency would resonate with the lift force at a shedding frequency ratio of 1.0, it resonates with the drag force at a ratio of 0.5 — half as much shedding rate is needed to hit the same natural frequency for this second, weaker force.
Drag-force amplitude is much smaller than lift-force amplitude, which is exactly why the original 1974 edition of ASME PTC 19.3 didn’t account for it. A smaller cyclic force seemed safe to ignore.
It isn’t, if the thermowell sits in that condition long enough. Drag-force resonance won’t snap a thermowell the way lift-force lock-in can. It fatigues it — slowly, cycle by cycle, over months or years of continuous operation.
This is the failure mode behind one of the most cited case studies in thermowell engineering: the 1995 incident at the Monju fast breeder reactor in Japan, where a thermowell failure in the sodium coolant system led to a leak and a shutdown that stretched for roughly 15 years.
The investigation traced the failure to flow-induced vibration that the thermowell’s original design — compliant with the 1974 standard at the time — had no requirement to check for, because that standard only evaluated the lift-force resonance condition.
(The exact technical sequence has been documented in various nuclear-industry post-incident reviews; treat this as the well-established headline cause rather than a clause-by-clause account, and consult a primary investigation report if you need that level of detail.)
That incident, and the standards review that followed it, is the reason the current ASME PTC 19.3TW excludes the frequency ratio band of 0.4 to 0.6 — the same 20% lock-in and tolerance margin applied around the drag-force resonance point at 0.5, the same way it’s applied around the lift-force resonance point at 1.0.
The chart below puts both zones on one curve — notice the smaller stress peak sitting inside the 0.4–0.6 band, and the much larger one sitting inside the 0.8–1.0 band.
(Insert the attached “thermowell-danger-zone-chart.svg” graphic here when publishing.)
When the limits don’t apply — Scruton number and Reynolds number
Neither danger zone is universal. ASME PTC 19.3TW allows you to relax — or in some cases completely waive — both limits, based on how well the thermowell can absorb vibration energy and how the fluid behaves around it.
The relevant damping parameter is the Scruton number, a measure of how effectively the thermowell’s own mass and structural damping resist being driven into vibration by a low-density fluid. A higher Scruton number means the thermowell naturally damps out vibration before it can build up — even near resonance.
The second condition is the Reynolds number of the flow. Below roughly 10⁵, the flow is more viscous relative to its velocity, and the vortices it sheds are weaker and less organized — less capable of driving sustained resonant vibration in the first place.
Put the two together and you get three working cases:
Case 1 — Scruton number low (commonly cited around below 2.5). The thermowell has little natural damping. Both Danger Zone 1 and Danger Zone 2 apply in full. This is the default, conservative case most thermowell sizing falls into.
Case 2 — Scruton number moderate-to-high, and Reynolds number below 10⁵. The thermowell has enough damping ability that the drag-force fatigue condition stops being a practical concern.
Danger Zone 2 (0.4–0.6) is no longer applicable — but Danger Zone 1 (0.8–1.0) still is, because lock-in is a structural-resonance phenomenon, not a fatigue-accumulation one, and damping alone doesn’t fully remove that risk.
Case 3 — Scruton number very high, and Reynolds number below 10⁵. With this much inherent damping and a flow regime too viscous to generate strong organized vortices, neither danger zone applies.
(Different references put this very-high threshold at slightly different values — some place it around 64, others around 65. Confirm the exact figure against the specific edition of ASME PTC 19.3TW you’re designing to before using it as a basis for waiving a frequency check.)
| Scruton number | Reynolds number | Result |
|---|---|---|
| Low (≲ 2.5) | Any | Both Danger Zone 1 and Danger Zone 2 apply |
| Moderate–high (≈ 2.5 to ~64–65) | < 10⁵ | Only Danger Zone 1 applies |
| Very high (≳ ~64–65) | < 10⁵ | Neither zone applies |
Frequency-ratio exemption logic, condensed from ASME PTC 19.3TW — verify exact thresholds against your edition before applying.
What this means for your next WFC calculation
A WFC that only checks “is the frequency ratio below 0.8” is checking half the standard. Before you sign off a thermowell, your calculation sheet should be answering three separate questions, not one:
- Is the frequency ratio outside 0.8 to 1.0?
- Is the frequency ratio outside 0.4 to 0.6 — or has the Scruton/Reynolds exemption been checked and documented to waive this requirement?
- If either limit is being waived on a damping or viscosity basis, is that basis recorded in the calculation file, not just assumed?
Note: vendor WFC software typically runs both checks automatically and flags exemptions where they apply — but the engineer reviewing the output is still the one who has to know why a 0.45 ratio passed, instead of just seeing a green checkmark and moving on.
This article covers the underlying logic. Final acceptance of any thermowell design is always against your project’s piping specification and the exact edition of ASME PTC 19.3TW called out in your contract documents — check both before closing out a WFC review.
EndNote
The framing of “two danger zones, not one” used throughout this article is built on a concept originally laid out by Asad Shaikh, an I&C engineer who writes at asad-shaikh.com — his piece on this exact topic, including the Monju case study, is worth reading in full if this is a topic you work with often. Credit to him for putting this lock-in-versus-drag-force distinction into a framework that’s easy to teach.
Have you run into a thermowell WFC that needed a Scruton number exemption on a real project? Drop it in the comments — these exemption cases come up far less often in practice than the standard zone-1 check, and real examples are genuinely useful for other engineers reading this.
you like this article, and if you want to know about Control System Engineering Vendor Deliverable List. Check out my previous article.
And you can also follow our LinkedIn group which is specially made for sharing information related to Industrial Automation and Instrumentation.