


Introduction
In the field of engineering, the Cause and Effect chart holds one of the most important roles.
Cause and effect charts are prepared by the combined effort of process and instrumentation engineers. After that person who develops logic for PLC/DCS uses this C&E Chart.
Cause and effect charts are generally represented by a table (we will see an example of it later in this article).
For any engineer, a C&E diagram is one of the most important documents. And it is generally prepared ESD and F&G systems.
What is Cause and Effect?
The C&E chart shows the relationship between the inputs which we call causes and corresponding outputs which we also call the effects for the process or the system for which the cause and effect is defined.
The C&E chart represents how the change in one input causes a change in another output as per the logic defined in the PLC or DCS or any other control system.
In short, the response of various outputs based on various inputs is shown in a C&E chart.
Importance of Cause and Effect in Engineering
The Cause and Effect charts are very important. The system’s behavior is totally dependent upon the logic defined in the PLC or DCS or any other control system.
The cause and effect show this logic in the form of a chart. When any system or plant trips, then based upon the action taken by the devices we can tell the cause of the tripping.
For new plants, cause and effect checking is very important because the loopholes can be identified in the cause and effect verification which prevents any dangers that can occur when the process or the system is running.
Also, after every shutdown, we refer cause and effect chart and do testing before start-up to ensure that the system or the process will behave as per design and also the PLC or DCS or any other control system will take actions as per the logic written in it.
Interpreting Cause and Effect Diagrams
Let us see what a C&E chart looks like and how we can read it.
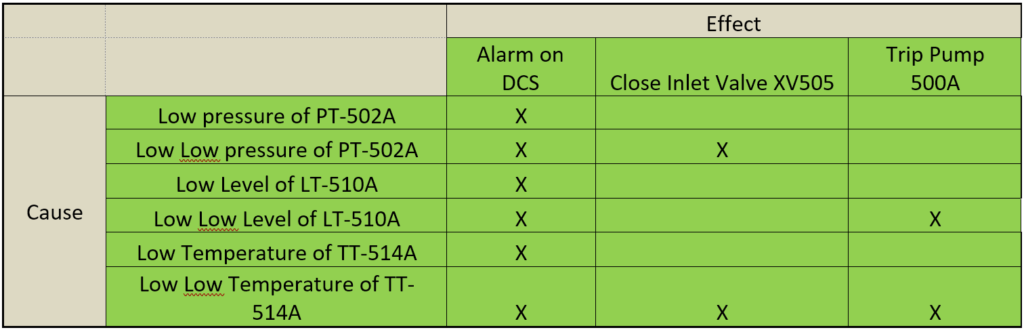
Below is the C&E chart of a tank containing a pressure transmitter, level transmitter, and temperature transmitter, an on-off valve in the inlet of the tank, and a pump in the outlet line from the tank.
| Effect | ||||
| Alarm on DCS | Close Command Inlet Valve XV505 | Trip Pump 500A | ||
| Cause | Low pressure of PT-502A | X | ||
| Low Low pressure of PT-502A | X | X | ||
| Low Level of LT-510A | X | |||
| Low Low Level of LT-510A | X | X | ||
| Low Temperature of TT-514A | X | |||
| Low Low Temperature of TT-514A | X | X | X | |
In the above chart, we can see various causes like:
- Low and Low Low pressure of PT-502A
- Low and Low Low Level of LT-510A
- Low and Low Low Temperature of TT-514A
We can also see some effects like:
- Alarm on DCS
- Close Command Inlet Valve XV505
- Trip Pump 500A
Now to read this C&E chart, simply take any cause. For example, Low Low Level of LT-510A.
Check the X marks in the row of that effect and trace the effects in the column corresponding to that X. So, the effects come out to be Alarm on DCS and Trip pump 500A.


So, we can conclude that if the LT-510A has low low level, then we will have an alarm on the DCS as well and the pump 500A will trip.
Similarly, for low temperatures of TT-514A, only an alarm on DCS will appear. This way we can read a cause and effect chart.
Testing Cause and Effect
Testing cause and effect is very important to ensure the accuracy and reliability of the logic defined in the PLC or DCS or any other control system.
Cause and effect can be checked by simulations of different parameters and checking whether the effect is being generated by the system or not.
While testing cause and effect, motors are generally kept in simulation mode so that they do not undergo multiple starts and stops which can damage the motors.
Frequency of Cause and Effect Testing
The C&E chart should be checked every 3 years or sooner than that as per system criticality and as per standards followed by the industry.
Any changes in the C&E should be noted and a signed-off copy should be recorded.
Also, while checking the C&E chart, if any discrepancy is found, then it should be discussed with the stakeholders and a proper analysis should be done.
Also, if any change in the system is made, then C&E should be checked.
Visual Representation in Graphics
The C&E chart is a very important document. Usually, this document is maintained in soft copies as well as signed copies.
But the graphics of PLC and DCS can also have a cause and effect page if configured. This is very interesting when it comes to seeing a system’s healthiness.
Let us see the example which we have discussed above. If no alarm is active then the graphics will look like :

Now if the alarm of Low Low Level of LT-510A actuates, then the graphics will change to :

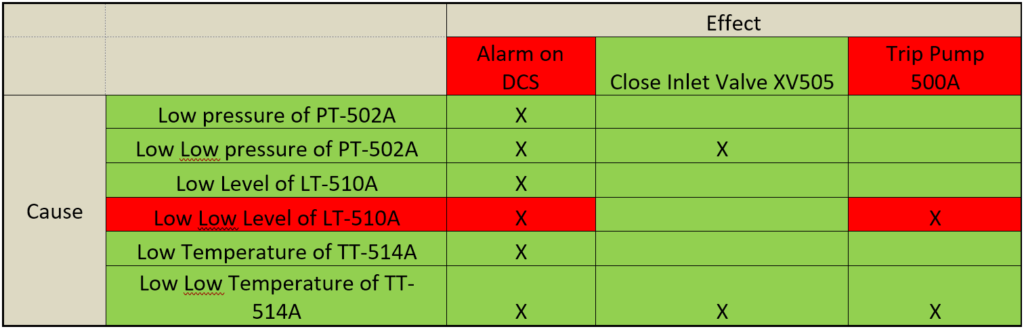
Here, the Red color represents active, and the green color represents the healthy state.
(NOTE: the color might change as per configurations.)
This was all about cause and effect. I hope now you understand the concept and the importance of cause and effect.
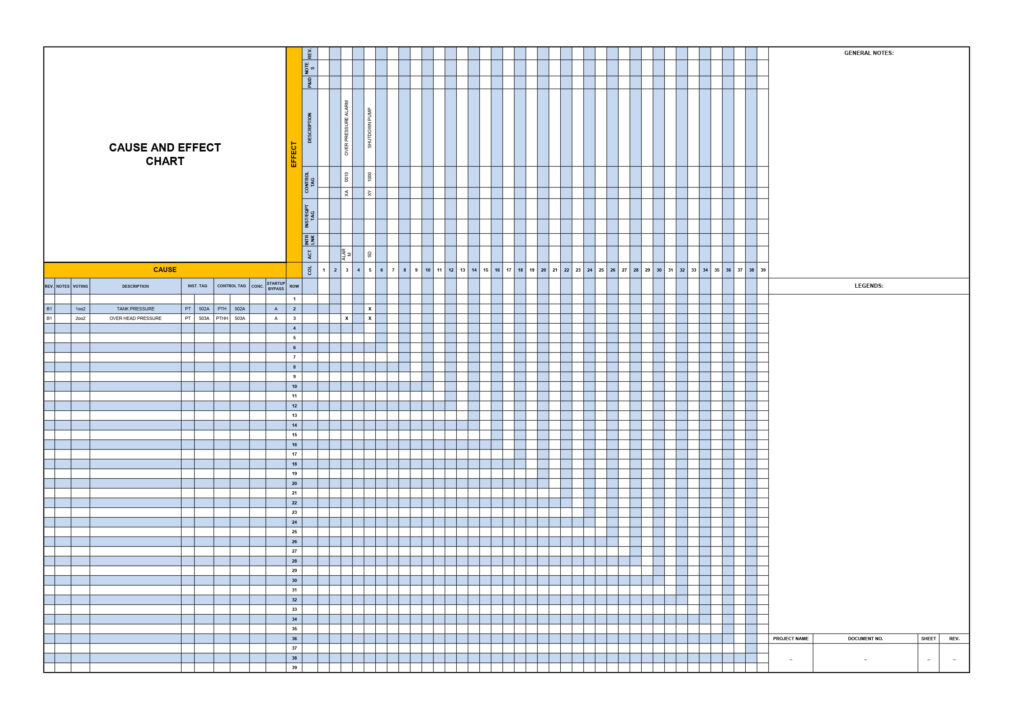
Example of the IO List:

EndNote
I hope these resources and Knowledge will become helpful to you in the future. You can also give your input through the comment section.
And I continue to make this type of resource and knowledge-sharing posts on my website.
If you have any suggestions then feel free to ask in the comments and through email id, if you want to write an article on the website, please contact us by this mail id: contact@worldofinstrumentation.com
If you like this article, you can also like my previous article on Temperature measurement without thermowell.
And you can also follow our LinkedIn group which is specially made for sharing information related to Industrial Automation and Instrumentation.


